mirror of
https://github.com/alibaba/arthas.git
synced 2024-04-21 10:21:39 +00:00

121 lines
3.2 KiB
Markdown
121 lines
3.2 KiB
Markdown
> Generate a flame graph using [async-profiler](https://github.com/jvm-profiling-tools/async-profiler)
|
|
|
|
[profiler command](https://arthas.aliyun.com/en/doc/profiler.html) supports generate flame graph for application hotspots.
|
|
|
|
The basic usage of the `profiler`{{}} command is `profiler action [actionArg]`{{}}
|
|
|
|
### View all supported actions
|
|
|
|
`profiler actions`{{execute T2}}
|
|
|
|
### View version
|
|
|
|
`profiler version`{{execute T2}}
|
|
|
|
### Start profiler
|
|
|
|
`profiler start --event cpu`{{execute T2}}
|
|
|
|
> By default, the sample event is `cpu`{{}} . Can be specified with the `--event`{{}} parameter.
|
|
|
|
### Get the number of samples collected
|
|
|
|
`profiler getSamples`{{execute T2}}
|
|
|
|
### View profiler status
|
|
|
|
`profiler status`{{execute T2}}
|
|
|
|
### Stop profiler
|
|
|
|
#### Generating html format results
|
|
|
|
By default, the result file is `html`{{}} format. You can also specify it with the `--format`{{}} parameter:
|
|
|
|
`profiler stop --format html`{{execute T2}}
|
|
|
|
Or use the file name name format in the `--file`{{}} parameter. For example, `--file /tmp/result.html`{{}} .
|
|
|
|
`profiler stop --file /root/arthas-output/result.html`{{execute T2}}
|
|
|
|
### View profiler results under arthas-output via browser
|
|
|
|
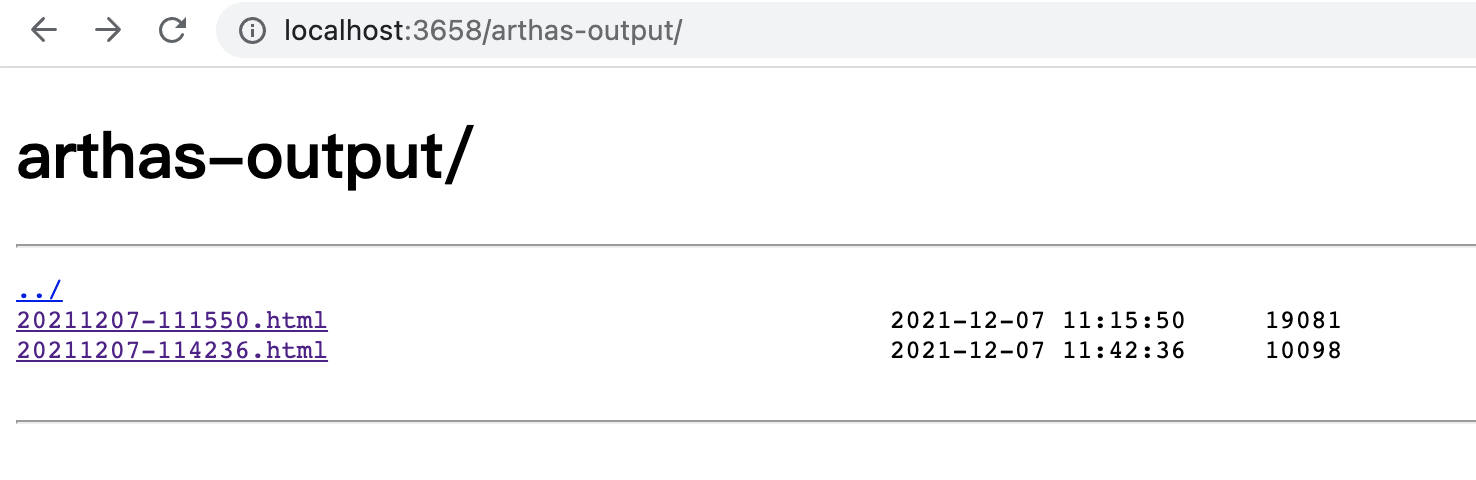
By default, arthas uses http port 8563, [click to open]({{TRAFFIC_HOST1_8563}}/arthas-output/) and enter username `arthas` and password `arthas` to view the `arthas-output`{{}} directory below Profiler results:
|
|
|
|
|
|
|
|
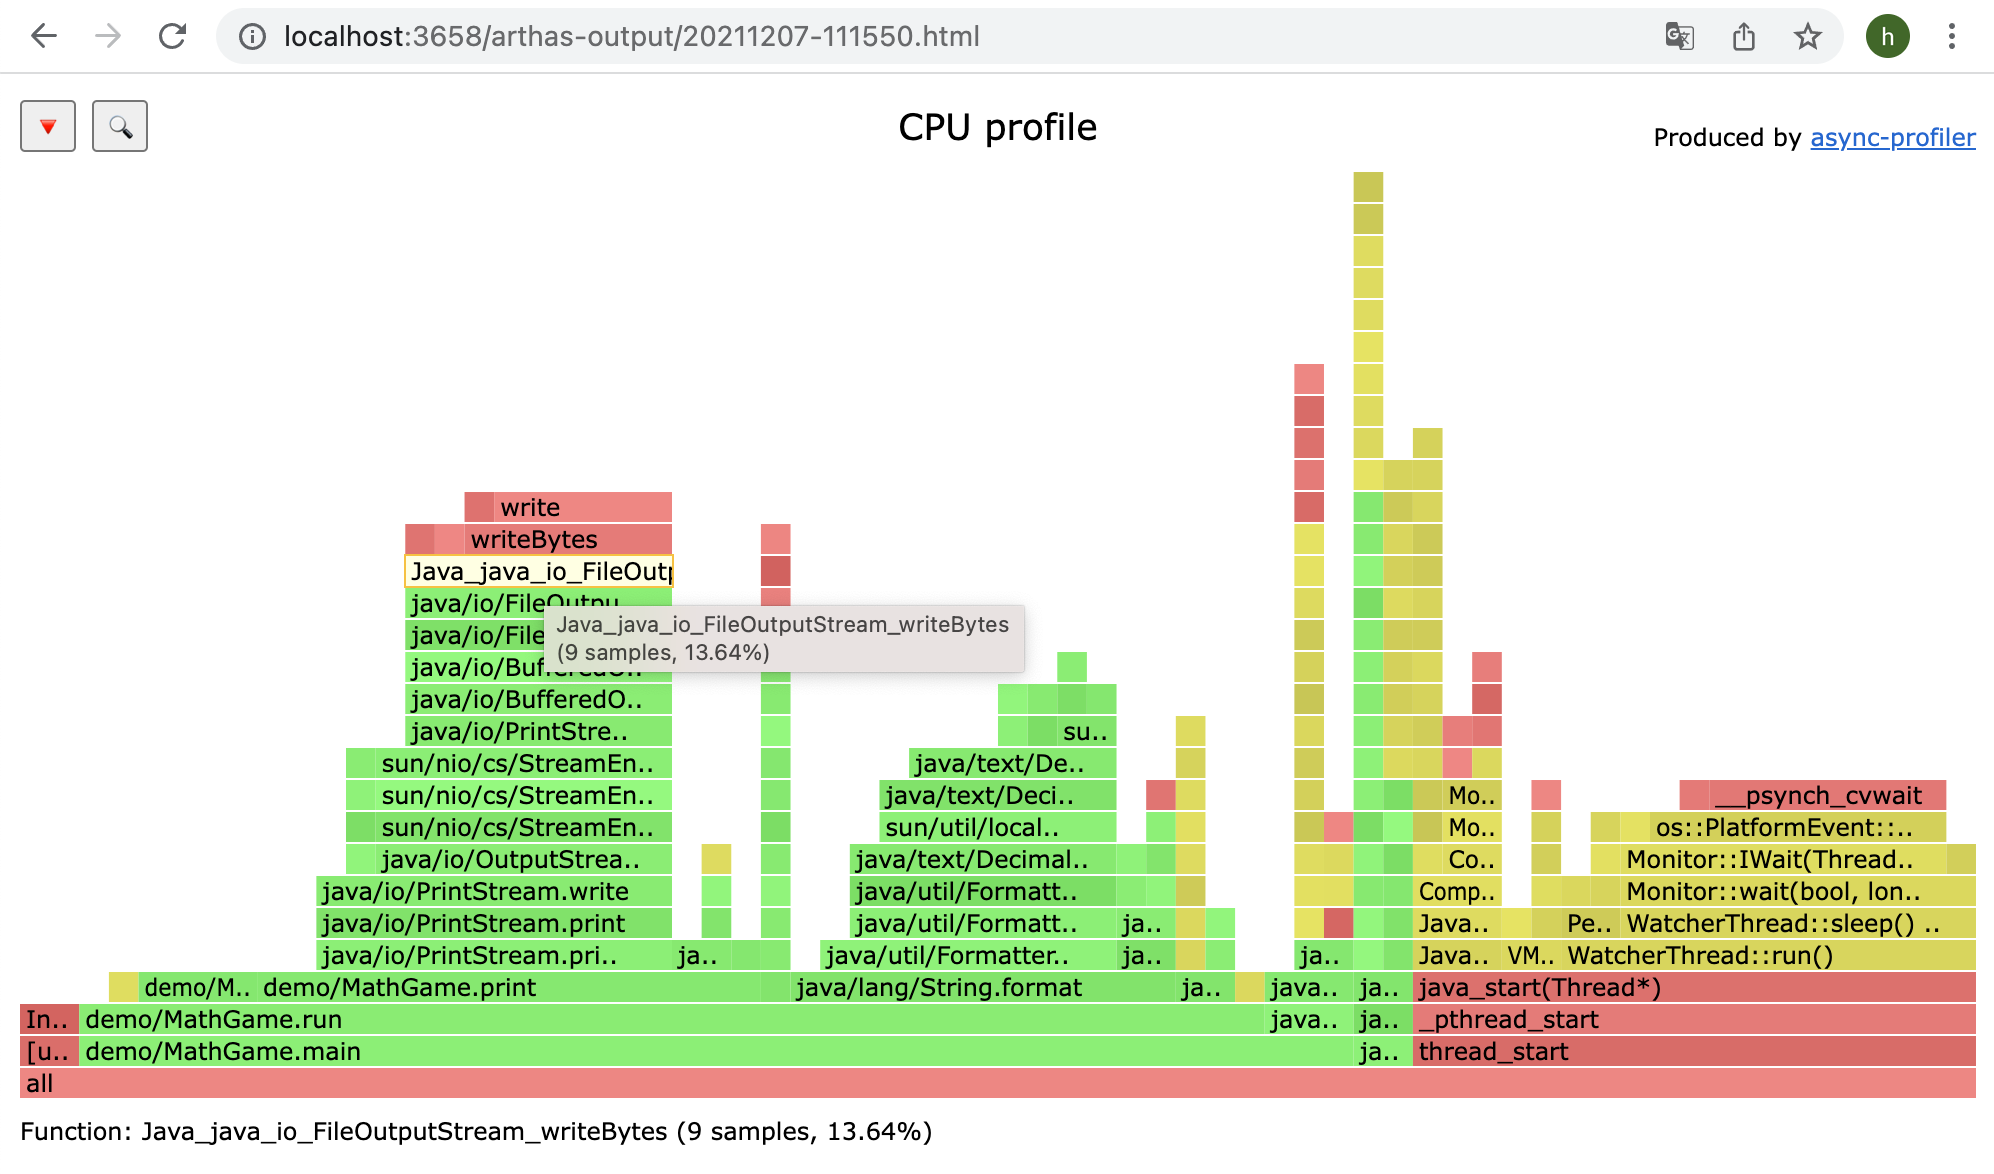
Click to view specific results:
|
|
|
|
|
|
|
|
### Profiler supported events
|
|
|
|
`profiler list`{{execute T2}}
|
|
|
|
Under different platforms and different OSs, the supported events are different. For example, under macos:
|
|
|
|
```bash
|
|
$ profiler list
|
|
Basic events:
|
|
cpu
|
|
alloc
|
|
lock
|
|
wall
|
|
itimer
|
|
```
|
|
|
|
Under linux
|
|
|
|
```bash
|
|
$ profiler list
|
|
Basic events:
|
|
cpu
|
|
alloc
|
|
lock
|
|
wall
|
|
itimer
|
|
Perf events:
|
|
page-faults
|
|
context-switches
|
|
cycles
|
|
instructions
|
|
cache-references
|
|
cache-misses
|
|
branches
|
|
branch-misses
|
|
bus-cycles
|
|
L1-dcache-load-misses
|
|
LLC-load-misses
|
|
dTLB-load-misses
|
|
mem:breakpoint
|
|
trace:tracepoint
|
|
```
|
|
|
|
If you encounter the permissions/configuration issues of the OS itself and then missing some events, you can refer to the [async-profiler](https://github.com/jvm-profiling-tools/async-profiler) documentation.
|
|
|
|
You can use the `--event`{{}} parameter to specify the event to sample, such as sampling the `alloc`{{}} event:
|
|
|
|
`profiler start --event alloc`{{execute T2}}
|
|
|
|
### Resume sampling
|
|
|
|
`profiler resume`{{execute T2}}
|
|
|
|
The difference between `start`{{}} and `resume`{{}} is: `start`{{}} is the new start sampling, `resume`{{}} will retain the data of the last `stop`{{}} .
|
|
|
|
You can verify the number of samples by executing `profiler getSamples`{{}} .
|
|
|
|
### Use `execute`{{}} action to execute complex commands
|
|
|
|
`profiler execute 'start,framebuf=5000000'`{{execute T2}}
|
|
|
|
For example, start sampling:
|
|
|
|
`profiler execute 'start,framebuf=5000000'`{{execute T2}}
|
|
|
|
Stop sampling and save to the specified file:
|
|
|
|
`profiler execute 'stop,file=/root/arthas-output/result.html'`{{execute T2}}
|
|
|
|
Specific format reference: [arguments.cpp](https://github.com/jvm-profiling-tools/async-profiler/blob/v2.5/src/arguments.cpp#L50)
|