mirror of
https://github.com/alibaba/arthas.git
synced 2024-04-21 10:21:39 +00:00

209 lines
4.7 KiB
Markdown
209 lines
4.7 KiB
Markdown
|
||
> 使用[async-profiler](https://github.com/jvm-profiling-tools/async-profiler)生成火焰图
|
||
|
||
`profiler` 命令支持生成应用热点的火焰图。本质上是通过不断的采样,然后把收集到的采样结果生成火焰图。
|
||
|
||
`profiler` 命令基本运行结构是 `profiler action [actionArg]`
|
||
|
||
### 参数说明
|
||
|
||
|参数名称|参数说明|
|
||
|---:|:---|
|
||
|*action*|要执行的操作|
|
||
|*actionArg*|属性名模式|
|
||
|[i:]|采样间隔(单位:ns)(默认值:10'000'000,即10 ms)|
|
||
|[f:]|将输出转储到指定路径|
|
||
|[d:]|运行评测指定秒|
|
||
|[e:]|要跟踪哪个事件(cpu, alloc, lock, cache-misses等),默认是cpu|
|
||
|
||
### 查看所有支持的action
|
||
|
||
`profiler actions`{{execute T2}}
|
||
|
||
```bash
|
||
$ profiler actions
|
||
Supported Actions: [resume, dumpCollapsed, getSamples, start, list, execute, version, stop, load, dumpFlat, actions, dumpTraces, status]
|
||
```
|
||
|
||
### 查看版本
|
||
|
||
`profiler version`{{execute T2}}
|
||
|
||
```bash
|
||
$ profiler version
|
||
Async-profiler 1.6 built on Sep 9 2019
|
||
Copyright 2019 Andrei Pangin
|
||
```
|
||
|
||
### 启动profiler
|
||
|
||
`profiler start -e itimer`{{execute T2}}
|
||
|
||
```
|
||
$ profiler start -e itimer
|
||
Started [itimer] profiling
|
||
```
|
||
|
||
> 默认情况下,生成的是cpu的火焰图,即event为`cpu`。可以用`--event`参数来指定。
|
||
> 因为katacoda环境不支持perf_events,所以这里使用`-e itimer`参数指定event为itimer
|
||
|
||
|
||
|
||
### 获取已采集的sample的数量
|
||
|
||
`profiler getSamples`{{execute T2}}
|
||
|
||
```
|
||
$ profiler getSamples
|
||
23
|
||
```
|
||
|
||
### 查看profiler状态
|
||
|
||
`profiler status`{{execute T2}}
|
||
|
||
```bash
|
||
$ profiler status
|
||
[itimer] profiling is running for 4 seconds
|
||
```
|
||
|
||
可以查看当前profiler在采样哪种`event`和采样时间。
|
||
|
||
### 停止profiler
|
||
|
||
#### 生成svg格式结果
|
||
|
||
`profiler stop`{{execute T2}}
|
||
|
||
```
|
||
$ profiler stop
|
||
profiler output file: /tmp/demo/arthas-output/20191125-135546.svg
|
||
OK
|
||
```
|
||
|
||
默认情况下,生成的结果保存到应用的`工作目录`下的`arthas-output`目录。可以通过 `--file`参数来指定输出结果路径。比如:
|
||
|
||
`profiler stop --file /tmp/output.svg`{{execute T2}}
|
||
|
||
```bash
|
||
$ profiler stop --file /tmp/output.svg
|
||
profiler output file: /tmp/output.svg
|
||
OK
|
||
```
|
||
|
||
#### 生成html格式结果
|
||
|
||
默认情况下,结果文件是`svg`格式,如果想生成`html`格式,可以用`--format`参数指定:
|
||
|
||
`profiler stop --format html`{{execute T2}}
|
||
|
||
```bash
|
||
$ profiler stop --format html
|
||
profiler output file: /tmp/test/arthas-output/20191125-143329.html
|
||
OK
|
||
```
|
||
|
||
或者在`--file`参数里用文件名指名格式。比如`--file /tmp/result.html` 。
|
||
|
||
`profiler stop --file /tmp/result.html`{{execute T2}}
|
||
|
||
### 通过浏览器查看arthas-output下面的profiler结果
|
||
|
||
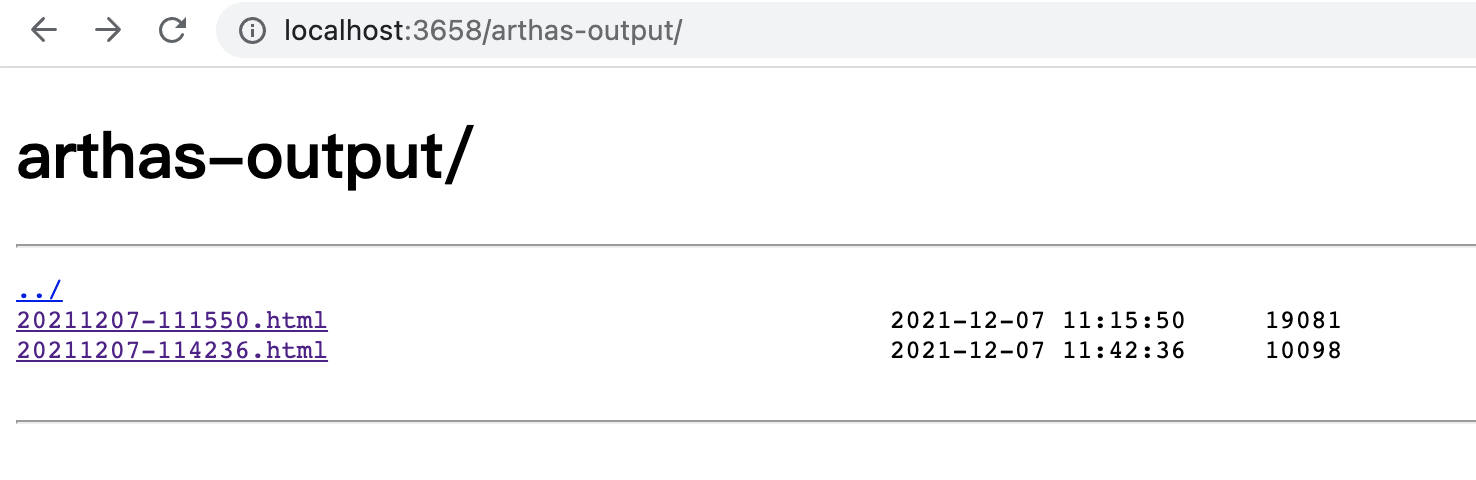
默认情况下,arthas使用8563http端口,则可以打开: https://[[HOST_SUBDOMAIN]]-8563-[[KATACODA_HOST]].environments.katacoda.com/arthas-output/ 目录下面的profiler结果:
|
||
|
||
|
||
|
||
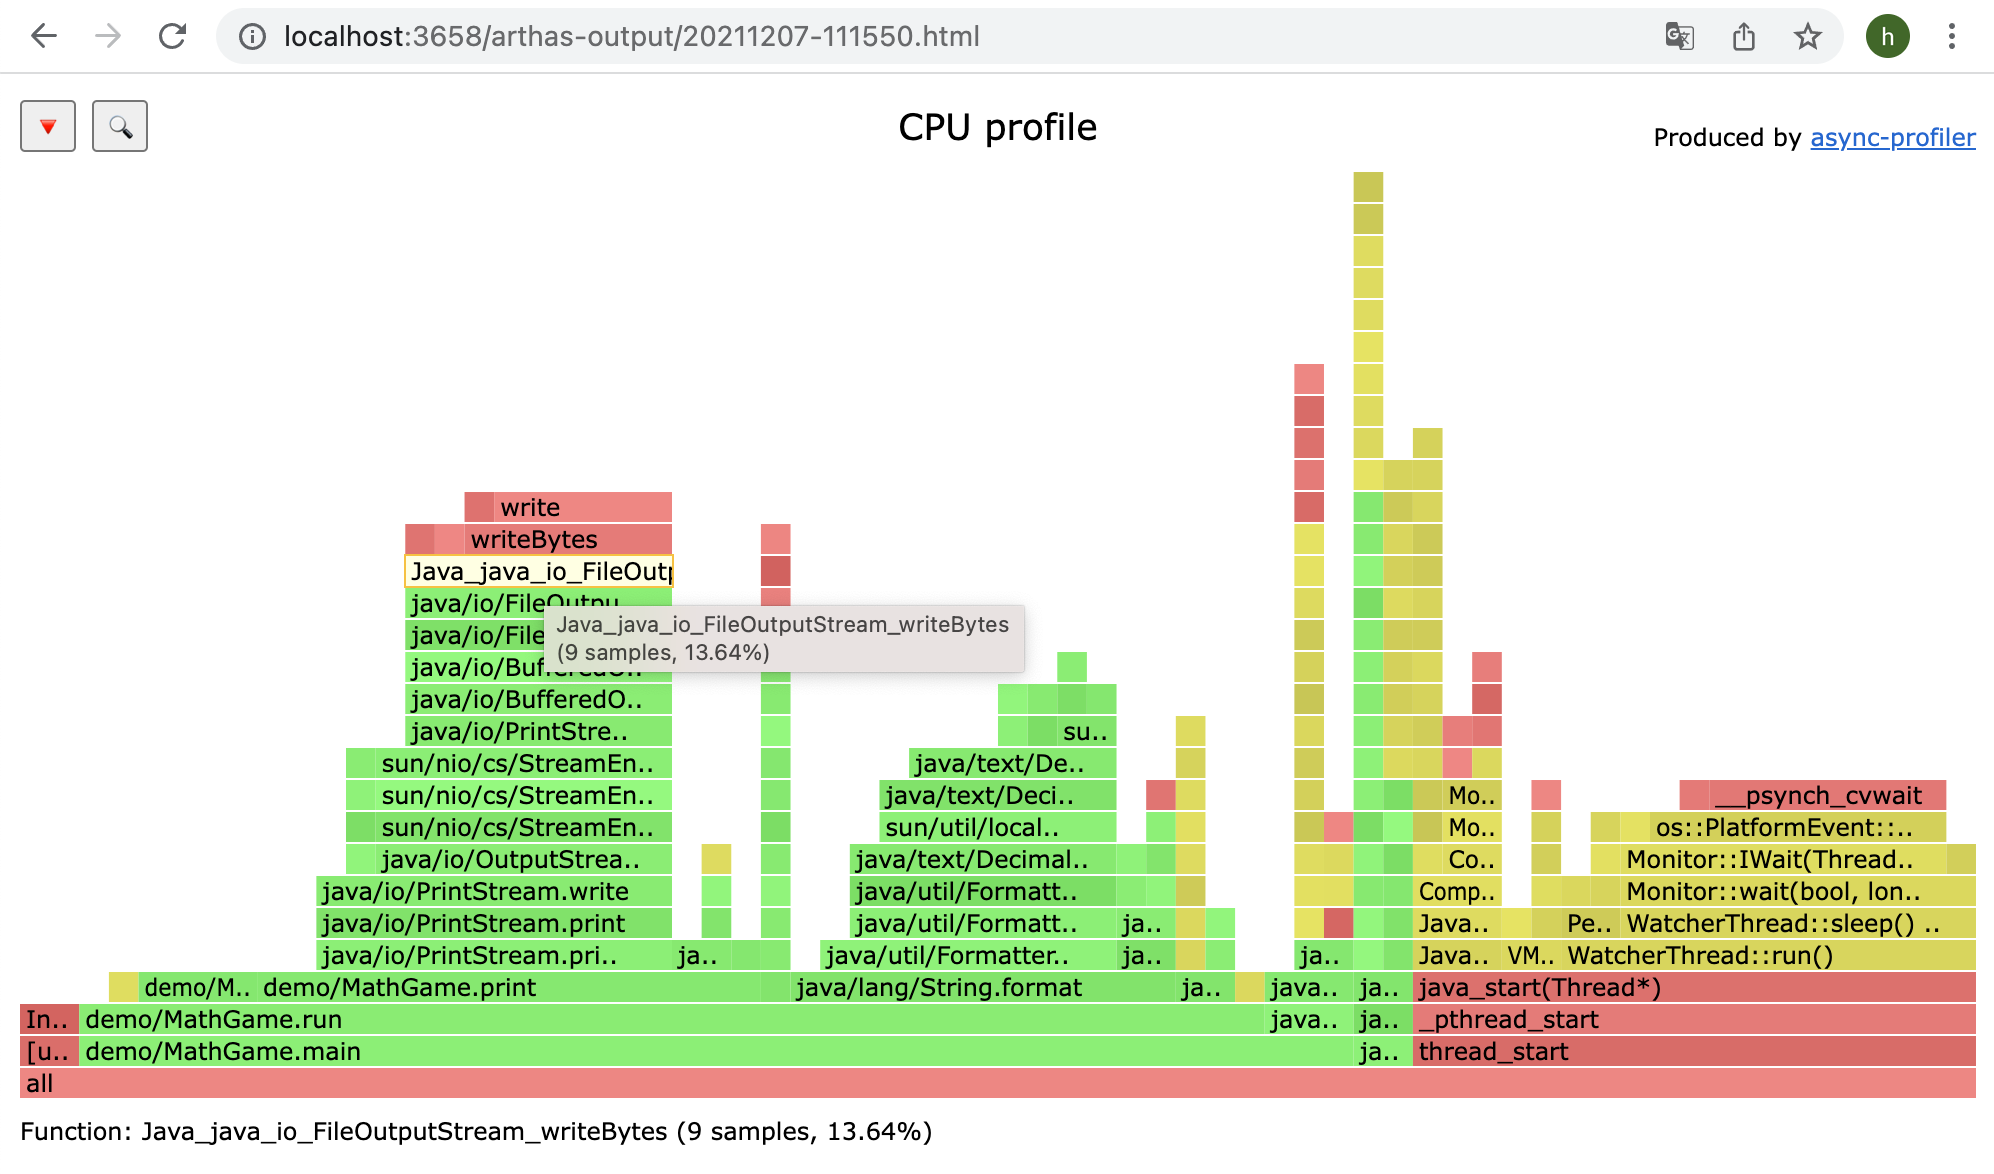
点击可以查看具体的结果:
|
||
|
||
|
||
|
||
> 如果是chrome浏览器,可能需要多次刷新。
|
||
|
||
### profiler支持的events
|
||
|
||
`profiler list`{{execute T2}}
|
||
|
||
在不同的平台,不同的OS下面,支持的events各有不同。比如在macos下面:
|
||
|
||
```bash
|
||
$ profiler list
|
||
Basic events:
|
||
cpu
|
||
alloc
|
||
lock
|
||
wall
|
||
itimer
|
||
```
|
||
|
||
在linux下面
|
||
|
||
```bash
|
||
$ profiler list
|
||
Basic events:
|
||
cpu
|
||
alloc
|
||
lock
|
||
wall
|
||
itimer
|
||
Perf events:
|
||
page-faults
|
||
context-switches
|
||
cycles
|
||
instructions
|
||
cache-references
|
||
cache-misses
|
||
branches
|
||
branch-misses
|
||
bus-cycles
|
||
L1-dcache-load-misses
|
||
LLC-load-misses
|
||
dTLB-load-misses
|
||
mem:breakpoint
|
||
trace:tracepoint
|
||
```
|
||
|
||
如果遇到OS本身的权限/配置问题,然后缺少部分event,可以参考`async-profiler`本身文档:[async-profiler](https://github.com/jvm-profiling-tools/async-profiler)
|
||
|
||
可以用`--event`参数指定要采样的事件,比如对`alloc`事件进入采样:
|
||
|
||
`profiler start --event alloc`{{execute T2}}
|
||
|
||
```bash
|
||
$ profiler start --event alloc
|
||
```
|
||
|
||
|
||
### 恢复采样
|
||
|
||
`profiler resume`{{execute T2}}
|
||
|
||
```bash
|
||
$ profiler resume
|
||
Started [cpu] profiling
|
||
```
|
||
|
||
`start`和`resume`的区别是:`start`是新开始采样,`resume`会保留上次`stop`时的数据。
|
||
|
||
通过执行`profiler getSamples`可以查看samples的数量来验证。
|
||
|
||
|
||
### 使用`execute`来执行复杂的命令
|
||
|
||
比如开始采样:
|
||
|
||
`profiler execute 'start,framebuf=5000000'`{{execute T2}}
|
||
|
||
```bash
|
||
profiler execute 'start,framebuf=5000000'
|
||
```
|
||
|
||
停止采样,并保存到指定文件里:
|
||
|
||
`profiler execute 'stop,file=/tmp/result.svg'`{{execute T2}}
|
||
|
||
```bash
|
||
profiler execute 'stop,file=/tmp/result.svg'
|
||
```
|
||
|
||
具体的格式参考: [arguments.cpp](https://github.com/jvm-profiling-tools/async-profiler/blob/v1.8.1/src/arguments.cpp#L50)
|